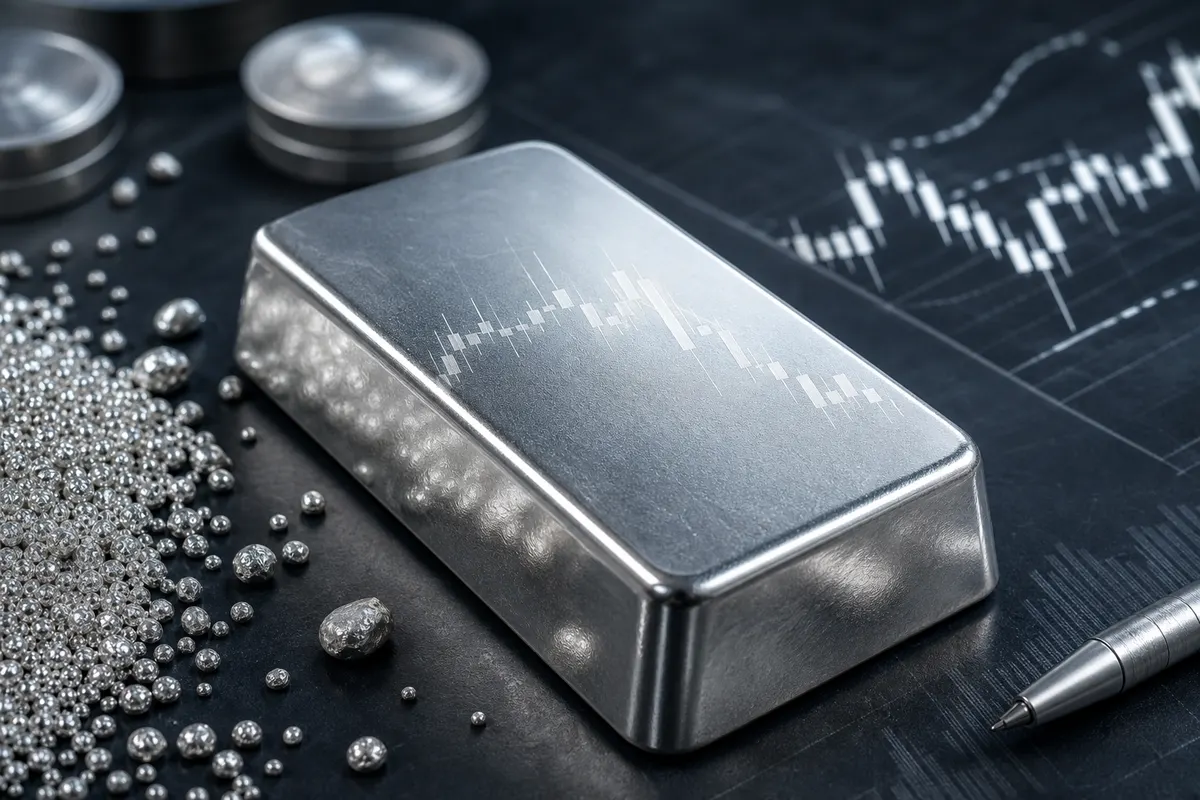
Daily silver price in any local market is built from two layers: the global price per troy ounce (usually based on COMEX trading or the LBMA benchmark) plus the FX conversion rate — mainly USD — plus domestic premium and dealer margin. When the ounce moves in London or New York, local 999.9 bar prices tend to move in the same direction, though with lag and different amplitude. Understanding the fundamentals behind these moves is essential for anyone planning to buy silver bars or sell physical holdings.
This analysis is part of the ../ investment article series. If you are not yet familiar with physical buying basics, read ../silver-bar-investment/; for comparison with gold, see ../silver-vs-gold/.
How Is the Global Silver Spot Price Set?
Spot silver is discovered through futures markets and over-the-counter (OTC) trading. Authoritative references such as the LBMA Silver Price publish benchmark prices twice daily. This price applies to 999.9 purity and underpins many physically backed ETFs. Reputable dealers typically calculate local prices from the latest global ounce multiplied by the prevailing USD rate and converted to grams. One troy ounce equals 31.1035 grams. Any deviation well beyond the usual formula should be questioned.
Industrial Demand: The Hidden Engine of Silver Prices
Unlike gold, which is mainly a store-of-value asset, more than half of global silver demand comes from industry. Use in photovoltaics (solar panels), electronics, electric vehicles, 5G, and medical equipment has grown sharply in recent years. According to annual reports from the Silver Institute, supply and demand are often in deficit — consumption exceeding mine output and recycling.
When industrial cycles expand, silver demand rises and price pressure increases. In global economic downturns, part of that demand falls and silver may come under more pressure than gold, because gold has stronger investment demand.
Silver in Solar Energy
Each silver-bearing solar panel requires a significant amount of silver paste for conductive electrodes. With national clean-energy targets, this segment is one of the most durable long-term demand sources for the metal, and professional investors factor it into fundamental analysis.
Mine Supply and Recycling
Most silver is produced as a by-product of copper, lead, and zinc mining, not from primary silver mines. Base-metal prices and producer decisions therefore affect silver supply. Global production statistics are published by agencies such as USGS.
Recycling from electronic and industrial scrap also plays a major supply role. Lower mine output or supply-chain disruptions — strikes, natural disasters, geopolitical tension — can push prices up quickly.
USD Rates and Monetary Policy
Silver, like other dollar-denominated commodities, is priced in USD. A stronger dollar usually puts downward pressure on the silver ounce (it becomes more expensive for non-dollar buyers) and a weaker dollar often does the opposite. Real interest rates matter too: when real rates are high, holding non-yielding silver has an opportunity cost and some investors shift to bonds.
In addition to the global ounce, the local FX rate is a second pricing layer. Sharp currency swings can amplify or offset ounce moves. Investors should monitor both variables. For daily quotes and purchase advice, contact Bazaarnoghre specialists via ../../../index.html#contact.
Gold-to-Silver Ratio
This ratio shows how many ounces of silver are needed to buy one ounce of gold. Historically it has ranged between roughly 30 and 90. When the ratio is high, some analysts view silver as relatively cheap versus gold — though that alone is not a definitive buy signal. Details are in ../silver-vs-gold/.
Long-term investors sometimes buy silver at historically high ratios and rebalance at lower ones. This strategy requires patience and an understanding of volatility risk.
Sentiment and Investment Flows
Silver ETFs such as SLV in the United States reveal capital inflows and outflows. During inflation fears or geopolitical crises, physical and fund demand often rise together and prices can spike. Conversely, forced selling to meet liquidity needs (margin calls) in financial markets can cause temporary drops.
In local markets, inflation expectations, exchange-rate policy, and seasonal demand also affect daily prices. Following official news and avoiding rumor-based decisions is essential.
Table of Factors Affecting Daily Silver Price
| Factor | Typical direction | Time horizon | Visible to retail investors |
|---|---|---|---|
| Global ounce (LBMA/COMEX) | Direct | Instant to daily | Yes — financial sites |
| Local USD/FX rate | Direct | Daily | Yes |
| Industrial demand (solar, electronics) | Up in expansion | Monthly to annual | Industry reports |
| Mine supply and recycling | Down when supply rises | Quarterly to annual | USGS and Silver Institute reports |
| Real USD interest rates | Down when rates rise | Monthly | Yes — central bank news |
| Gold-to-silver ratio | Relative value signal | Long term | Yes |
| Domestic premium and spread | Affects final buy/sell price | Stable to variable | Yes — dealer quotes |
How to Monitor Daily Silver Price for 999.9 Bar Purchases
A practical approach:
- Note the global silver ounce from a trusted source
- Multiply by today's USD rate and convert to grams
- Add dealer premium and shipping cost
- Compare offers from several reputable sellers — including ../../../index.html#products; Bazaarnoghre publishes prices transparently based on the LBMA ounce and current rates
For physical buying, a board price alone is not enough; delivered all-in cost is the main benchmark. At resale, buyers may quote 2–5% below spot — that spread is part of physical market liquidity cost.
Price Forecasts: What Is and Is Not Possible
No one can predict daily silver price with certainty. Fundamental analysis (supply, demand, market deficit) and technical analysis (trend, support, resistance) are aids, not guarantees. Retail investors are better served by gradual buying (DCA) and a long horizon than by betting on short-term direction.
If you plan to buy bars, align timing with personal goals: physical silver is designed for multi-year holding, not day trading. To verify authenticity of purchased bars, read ../silver-authenticity-storage/.
Global Crises and Economic Cycles
In wars, geopolitical tension, and banking crises, institutional investors move toward physical assets and safe-haven demand rises. Silver often moves with gold in such periods, though its swings may be sharper. In recovery after recession, silver's industrial engine accelerates again — installed solar panels, new phones, and electric vehicles all need silver paste and silver contacts.
Understanding these cycles helps you avoid emotional reactions to headline news. Daily price is one point on a chart; monthly and annual trends matter more. Tools such as ounce charts on CME Group are useful for long-term trend tracking.
Summary
Daily silver price reflects global balance of supply, industrial demand, monetary policy, and market sentiment. By tracking the global ounce, USD, gold-to-silver ratio, and domestic premium, you can make more informed decisions. For transparent 999.9 bar quotes with proof of authenticity, consider ../../../index.html#contact.
Further reading
Related articles
To view 999.9 fine silver products, visit the Bazaarnoghre products page.